A Test Dataset for GNSS and INS Integrated Positioning Technology in Different Types of Environment
A novel dataset is proposed to provide the raw data of GNSS signal and inertial measurement unit (IMU) for receiver testing. The data of GNSS signal mainly contain two types which are the digital intermediate frequency (IF) data and the raw signal measurements respectively. In addition, the attitude information of receiver are measured by three IMU devices with different accuracy simultaneously.
Collecting platform
We choose Shanghai, which is one of the largest cities in China, as the target place to study. It contains most typical environmental features of the city like skyscraper, viaduct, boulevard etc. Targeting on the vehicular positioning applications, all the collecting devices are mounted on a van. Figure 1 shows the collecting platform of GNSS data and the photo of van roof. It can be seen that two GNSS antennas are mounted on the van. The auxiliary antenna is only used for the calibration system. The signal received by the main antenna is transmitted to calibration system, signal sampling device, SBG IG-500N and Ublox M8P receiver simultaneously though a power splitter. The calibration system is the NovAtel SPAN equipment which contains a high performance receiver (NovAtel PP6D) and a high accuracy IMU (iMAR FSAS) (Kennedy et al. 2007). An android mobile phone is fixed beside the main antenna to log the raw GNSS measurements in real time.
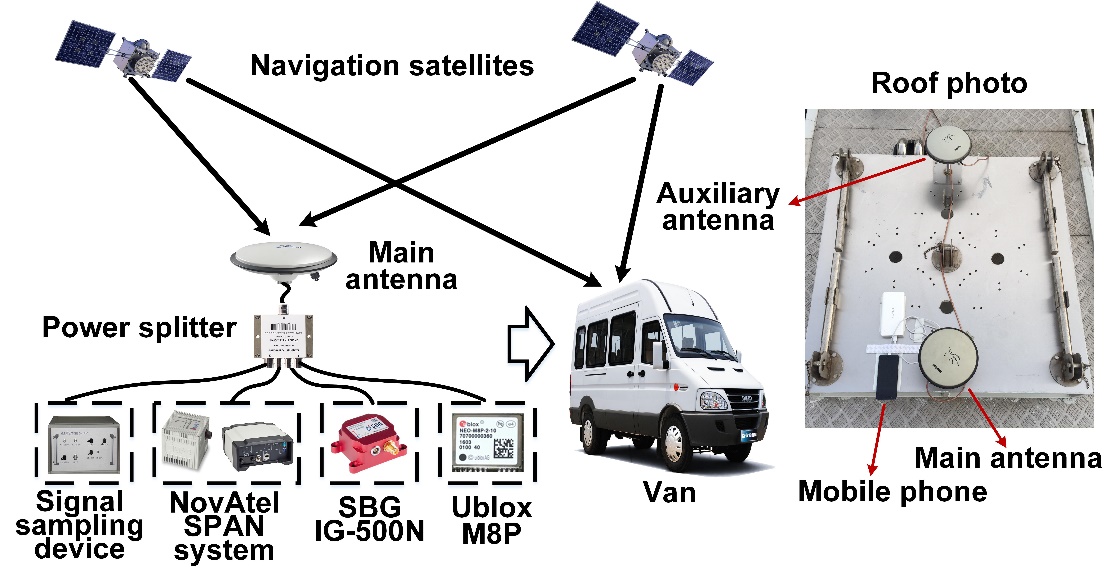
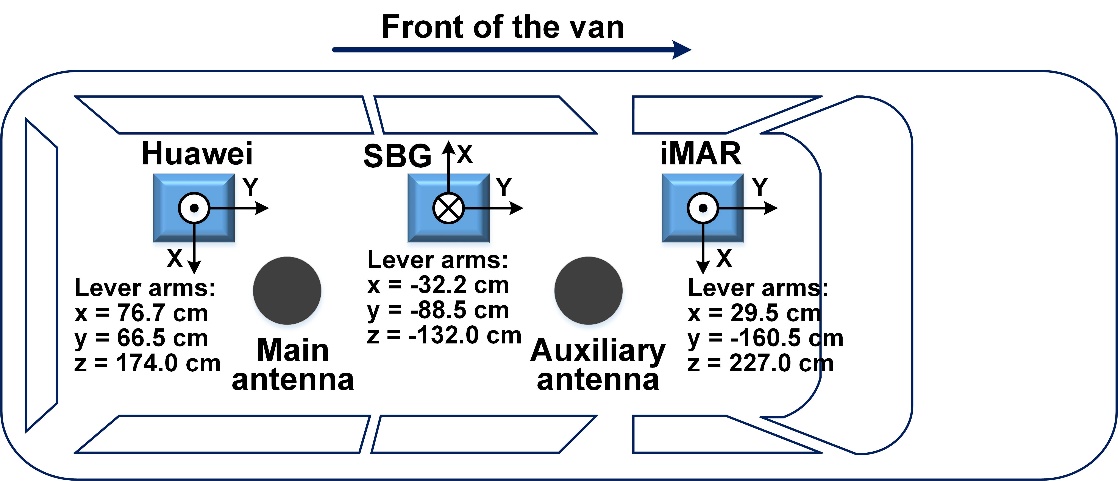
Fig. 1 The platform of dataset collecting
As described in the introduction section, four sets of GNSS signal raw data are collected by different devices, which are summarized in table 1. The table 2 shows the detailed parameters of the high performance antennas which are important to the signal quality.
Table 1 The data description of GNSS signal
Table 2 The parameters of main antenna
To study the integrated navigation technology, the attitude information of the van are collected by three different IMU devices. Another mobile phone with the same model is used to collect the IMU measurements, because one mobile phone cannot record the measurements of GNSS and IMU simultaneously. All the IMU devices is fixed in the van and the description is shown in the table 3.
Table 3 The data description of IMU devices
Collecting Envirnment
All these data are collected in five typical types of environment which are downtown, town, suburb, boulevard and viaduct-down. Figure 2 shows the live photos of each scene which have significant differences between each other. The exterior description of these scene are given as follows.
- Downtown: In this environment, a large number of skyscrapers are built densely on the both sides of the road. The GNSS signal will be easily blocked and multipath interference is serious.
- Town: Most houses are low-rise buildings, and only a few tall buildings are distributed sparsely.
- Suburb: The quality of most signals are very good in this scene, so GNSS receivers can achieve a high positioning accuracy.
- Boulevard: The power of most signals are attenuated by leaves, and a lot of short delay multipath signals can be received.
- Viaduct-down: In this scene, the van runs under the viaduct. Most GNSS signals are blocked, and the DOP value is high.
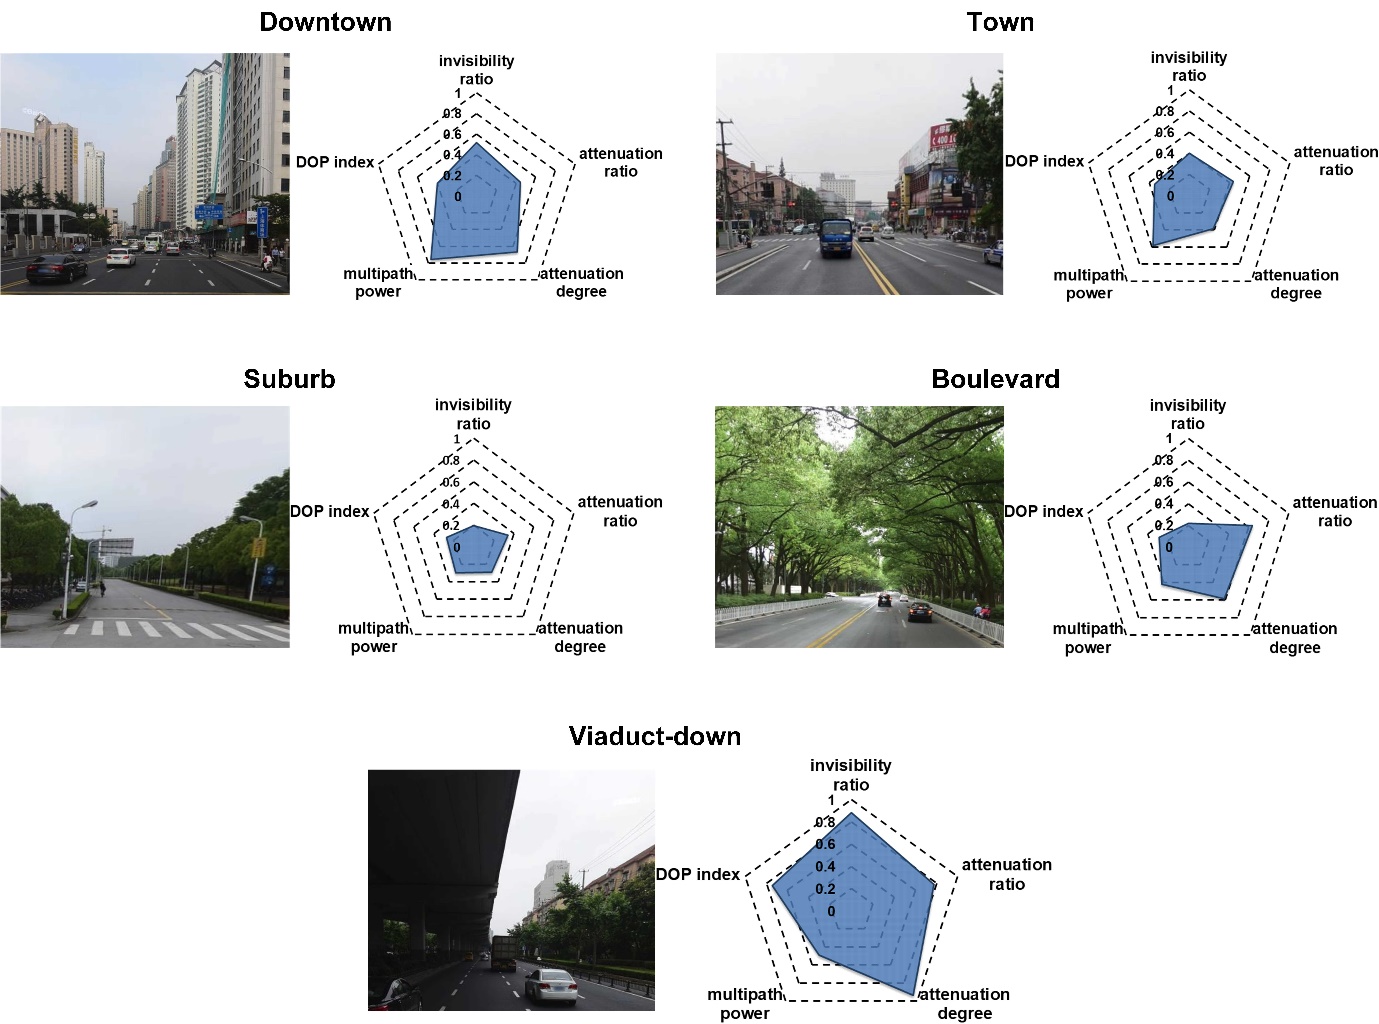
Fig. 2 Live photos of each typical environment
The radar charts are used to describe the statistical signal characteristics of the environment, and the shadow area represents the poor level of signal quality. in the radar charts, five typical signal features are proposed as follows.
- Invisibility ratio: represents the number of visible satellites that can be used for positioning.
- Attenuation ratio: represents the proportion of the signals with poor quality in all received signals.
- Attenuation degree: represents the mean attenuation of the poor quality signals.
- Multipath power: represents the intensity of multipath interference.
- DOP index: represents the deterioration of the GDOP value.
Download center
Open source codes:
1. the acquisition codes for IF signal data;
2. the processing codes for cell phone measurements.
Download link: Open Source Codes.rar (1 MB)
Test dataset
The first compression package contains the raw measurements of GNSS signal and IMU, the calibrated position and the ephemeris file. The digital IF signal data need to be downloaded individually, because its volume is very large.
| Downtown environment | Downtown_20180415.rar (20.4 MB)
rawData_GNSS_IF_signal_Downtown_20180415.part1.rar (70 GB) rawData_GNSS_IF_signal_Downtown_20180415.part2.rar (61.8 GB) |
| Town environment |
Town_20180324.rar (20.6 MB) |
| Suburb environment |
Suburb_20180415.rar (17.6 MB) |
| Boulevard environment |
Boulevard_20180415.rar (15.6 MB) rawData_GNSS_IF_signal_Boulevard_20180415.part1.rar (95 GB) rawData_GNSS_IF_signal_Boulevard_20180415.part2.rar (35.6 GB) |
| Viaduct-down environment |
Vaiduct-down_20180415.rar (13.4 MB) |