RESEARCH BACKGROUND
The open access to GNSS raw measurements on Android smartphones is important for both the development of GNSS and smartphones, as we may experience higher accuracy LBS (Location Based Service) with lower cost devices in the future. Nowadays the ultra-low cost GNSS chipset in smartphone has the characteristics of low power consumption, low-quality antenna and limited computing resources, so it is far from being comparable with survey-grade or commercial-grade GNSS receivers. These characteristics also lead to poor quality measurements and low complexity PVT methods. Our group focuses on the impact of the duty cycle mode in low-power GNSS chipset on the carrier phase observations and systematically discusses the feasibility of reconstructing intermittent carrier phase measurements, which is important for achieving high precision based on low-cost mobile devices.
Research contents
Analysis of Intermittent ADR Measurements
Three approaches for analyzing the intermittent ADR measurements are summarized as following.
Code-minus-carrier: Pseudorange is an absolute measurement and does not depend on the continuous tracking of the signal, so the duty cycle mode has almost no effect on pseudorange observations. Under the continuous observation for a long time, the trend of pseudorange and ADR can be compared by making difference between them.
Cycle slip detection: Traditional cycle slip problem is basically caused by signal loss, blocking or receiver hardware failure, so the detection idea for this problem is to detect the discontinuity of the measurements in time and estimate the value of cycle slip. Duty cycle mode will lead to discontinuous tracking of the carrier phase, but whether this is a traditional cycle slip problem remains to be verified.
Post-processing based on short baseline single difference: This method establishes a single difference observation model first, then it separates the measurement errors from the raw measurements based on many prior information such as the true position of reference and rover station, receiver clock bias and drift etc. At last, this method estimates the carrier phase observations of continuous tracking and compares them with the raw ADR measurements.
Duty-cycle Tracking Model
There are three different scales of time slot in GNSS baseband signal processing. They are described below.

![]() is called the integrate and dump slot. It is the most basic signal processing unit and cannot be further divided.
is called the integrate and dump slot. It is the most basic signal processing unit and cannot be further divided.
![]() is called the duty-cycle slot. It contains N , where N is an integer. This time slot is divided into two parts: working time and sleeping time . contains the first k , and contains the remaining N-k , where k is also an integer. The duty ratio (DR) in the intermittent signal processing is defined as follows:
is called the duty-cycle slot. It contains N , where N is an integer. This time slot is divided into two parts: working time and sleeping time . contains the first k , and contains the remaining N-k , where k is also an integer. The duty ratio (DR) in the intermittent signal processing is defined as follows:
![]() is called the epoch slot. It is the update interval for GNSS measurements and contains M , where M is an integer. This time slot reflects the average Doppler of input signal during this period.
is called the epoch slot. It is the update interval for GNSS measurements and contains M , where M is an integer. This time slot reflects the average Doppler of input signal during this period.
Two different carrier tracking models are defined as follows: 1) If DR equals 100%, this is a continuous tracking model. 2) If DR is less than 100%, this is a duty-cycle tracking model. For the continuous tracking model, only loop filter and NCO need to be updated at each integrate and dump slot, while other modules do not require any changes. The loop filter updates only the result of its internal integrator, while the filter parameters remain unchanged. NCO adjusts the output frequency in each and keeps the continuity of the local carrier phase. Because there is no sleeping time, PLL has no interruption of carrier tracking in an epoch slot, so the local NCO signal is a good copy of the input signal. For the duty-cycle tracking model, DR usually takes a relatively small value, such as 10%, in order to reduce the power consumption as much as possible. During the period, the situation is the same as that of a continuous tracking model. However, during the period, the NCO will continue to generate local replicas with the of the last time, and the result of the internal integrator in the loop filter will also be consistent with the result of the last time.
Reconstruction and Evaluation for ADR Measurements
Duty cycle mode has caused some negative effects on carrier tracking, mainly including the following two aspects: 1) Because of the relative motion between satellites and receiver, the carrier Doppler is changing all the time. The duty cycle mode leads to measurement error because it cannot measure the Doppler change during sleeping time, what is worse, this error accumulates over time. 2) Because the integrator in the loop filter is not able to update during sleeping time, loss of lock occurs at the reentry time and the output of the loop filter generates an overshoot. These two reasons lead to measurement errors in ADR observations together, and this destructive effect has become more serious as time goes on. This phenomenon is called continuous loss of cycles.
The derivative of ADR is Doppler, because Doppler is a set of discrete samples and it can be considered that it changes linearly in a very short time. On the basis of the above facts, we propose an ADR reconstruction algorithm based on Doppler resampling. The basic idea is to resample the discrete Doppler in order to obtain the Doppler correction, then the Doppler correction is used to reconstruct the ADR measurements. Our method acquire the accurate prior value of baseline vector first, then the classical LAMBDA algorithm is used to fix the float solution. If raw ADR measurements are not reconstructed, the double difference integer ambiguities vary all the time. On the contrary, if the reconstruction algorithm is effective, the fixed solution is close to a constant in a period of time which means that the variance is small.
Experimental ENVIRONMENT
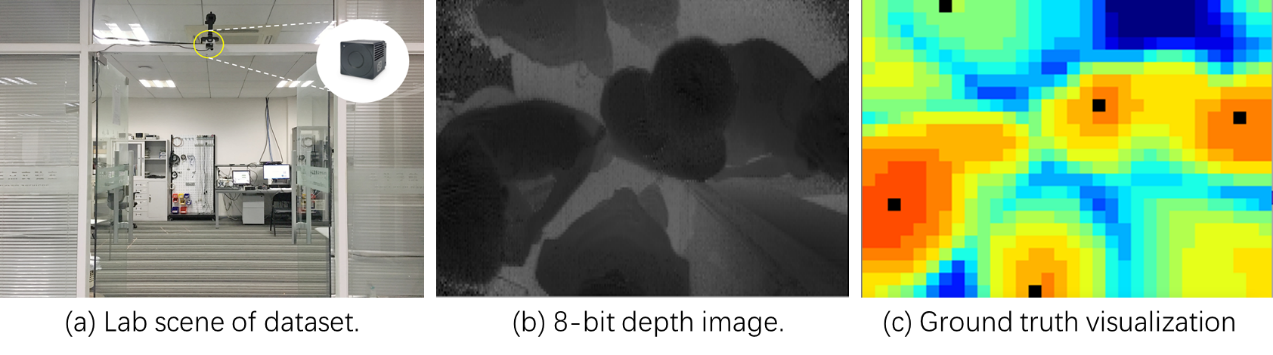
In order to verify the effect of the proposed ADR reconstruction algorithm in the real scene, the smartphone experiment is designed as follows. The position of the reference station’s antenna is prior known. First, the position of the rover stations need to be calibrated. The reference station is NovAtel’s PP6 receiver, while the rover station is NovAtel’s PP6D receiver, and the baseline length is about 400m. We use the Waypoint Inertial Explorer software to process the data and obtain the position of rover with centimeter level accuracy. Then, we use Huawei P10 smartphone instead of rover station and collect raw static data with the reference PP6 receiver at the same time.

EXPERIMENTAL RESULTS
Three Methods for Analyzing Intermittent ADR Measurements
Figure 1 and Figure 2 show the analysis results obtained from the above three methods for the same set of data. The experimental results of method 1 and 3 for two satellites are shown in Figure 1.a, all these results indicate that the deviation between raw ADR and real distance will be accumulated over time, and the deviation is about -0.67 m/s. Figure 1.b depicts the differences between the two methods for G3 and G17, it is obvious that the method 1 is much more coarser than the method 3, which stems from the noise of pseudorange. Figure 2 shows the results of the cycle slip detection for G3 and G17, using the 4th order difference method, and they produce 122 (G3) and 112 (G17) cycle slips in about one hour, respectively. The number of cycle slips has exceeded the threshold (3%), which indicates that there are very unusual problems in the raw measurements, but these irregular cycle slips cannot help to find the causes of the underlying problems. Based on the above analysis, we believe that the problem of ADR measurements of smartphone is not the traditional cycle slip problem.
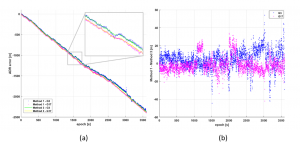
Fig. 1. Code-minus-carrier vs. Post-processing based on short baseline single difference
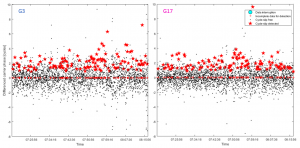
Fig. 2. The results of cycle slip detection
Simulation Results for Duty-cycle Tracking Model
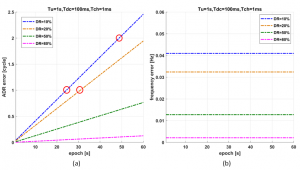
Whether the receiver is static or dynamic, because the satellite is moving, there is a relative motion between them, and this relative motion leads to a slight change in the carrier Doppler during an epoch slot. In duty-cycle tracking model, PLL will lose track of the carrier Doppler change during the period. Figure 3.a shows the simulation results of ADR errors with different DR, Doppler of the test signal changes from 10Hz to 70Hz in a minute. It is clear that a few integer cycles are lost in a very short time when DR is relatively small (see the red circle shown in Figure 3.a). In addition, when DR gets smaller, the loss of cycles gets larger. Figure 3.b shows the Doppler errors with different DR, it is easy to see that the Doppler error is very small and does not accumulate.
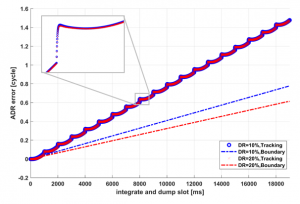
Entry time is defined as the moment from working time to sleeping time, and reentry time is defined as the moment from sleeping time to working time. At the entry time, the integrator in the loop filter interrupts the integral operation. At the reentry time, PLL fails to lock the signal and returns to pull-in state due to the incomplete integration. In most cases, is longer than the pull-in time, that is, during the period, PLL will reenter the lock state from the pull-in state. Therefore, in duty-cycle tracking model, PLL will cycle in three states: pull-in, lock and sleep. This frequent state switching can also cause the loss of cycles, because the output frequency difference of the loop filter is not accurate when PLL is in pull-in state. Figure 4 shows the simulation results under two different DR (10% and 20%). Compared with the error lower boundary, there are two differences in tracking error, one is obvious overshoot and the other is a larger slope. As mentioned above, these are the results of frequent loss of lock in PLL.
Analysis of ADR Reconstruction Results
Figure 5.a shows the fixed solutions of five groups of double difference ambiguities in the experiment, where the red represents the results before reconstruction, and the blue represents the results after reconstruction. Several groups of red results show the characteristics of time drift, but the other groups are not obvious, mainly because the raw ADR measurements are also affected by other factors, such as the multipath effect, etc. Compared with the red results, the time drift characteristics of the blue results are very small, basically maintained in a constant range, which can be seen from their variances. In this static test, the accurate estimations of double difference integer ambiguities can be obtained by using post-processing, so we can calculate the baseline vector before and after reconstruction, as shown in Figure 5.b and Figure 5.c. The red results show that there is a deviation between the baseline solutions and the static reference, while the blue results are mainly in the circle of the static reference with a radius about 3m. This accuracy indicates that the raw ADR measurements are not only affected by intermittent tracking, but also other serious problems, such as noise, multipath and so on, so there is still much work to be done to improve the accuracy to the centimeter level.
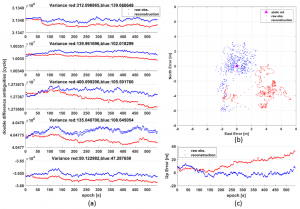
Fig. 5. Double difference integer ambiguities and baseline vector calculated by reconstructed ADR measurements


